The defining macro event of the quarter was the Iran war, which sent crude prices surging 63% in a single month, the largest monthly gain on record, while average US gas prices rose 35% over the month. Against this backdrop, the Federal Reserve held rates steady at 3.50% to 3.75%, with Chair Powell acknowledging meaningful uncertainty around the war’s inflationary impact, and Fed funds futures are now pricing in a 29% probably of a rate cut in 2026.
The Fed remains in a difficult position as it balances inflation risks against unemployment concerns, weak consumer sentiment, and resilient retail spending. Headline CPI came in at 2.4% for February, down modestly from December’s 2.7%, while PCE, the Fed’s preferred inflation gauge, rose slightly to 3.1% in January from 3.0% in December. Unemployment continues to hover around 4.4%, and initial jobless claims have risen since the start of the year, with the latest reading at 210k. Consumer sentiment remains near 53.3, a level below 98% of historical observations. Despite this backdrop, retail sales increased 0.6% month over month in February, a solid reading, though surveys suggest March may soften as higher energy costs weigh on consumers.
-----------------------------------------------------------------------------------------------------------------------------------------------------
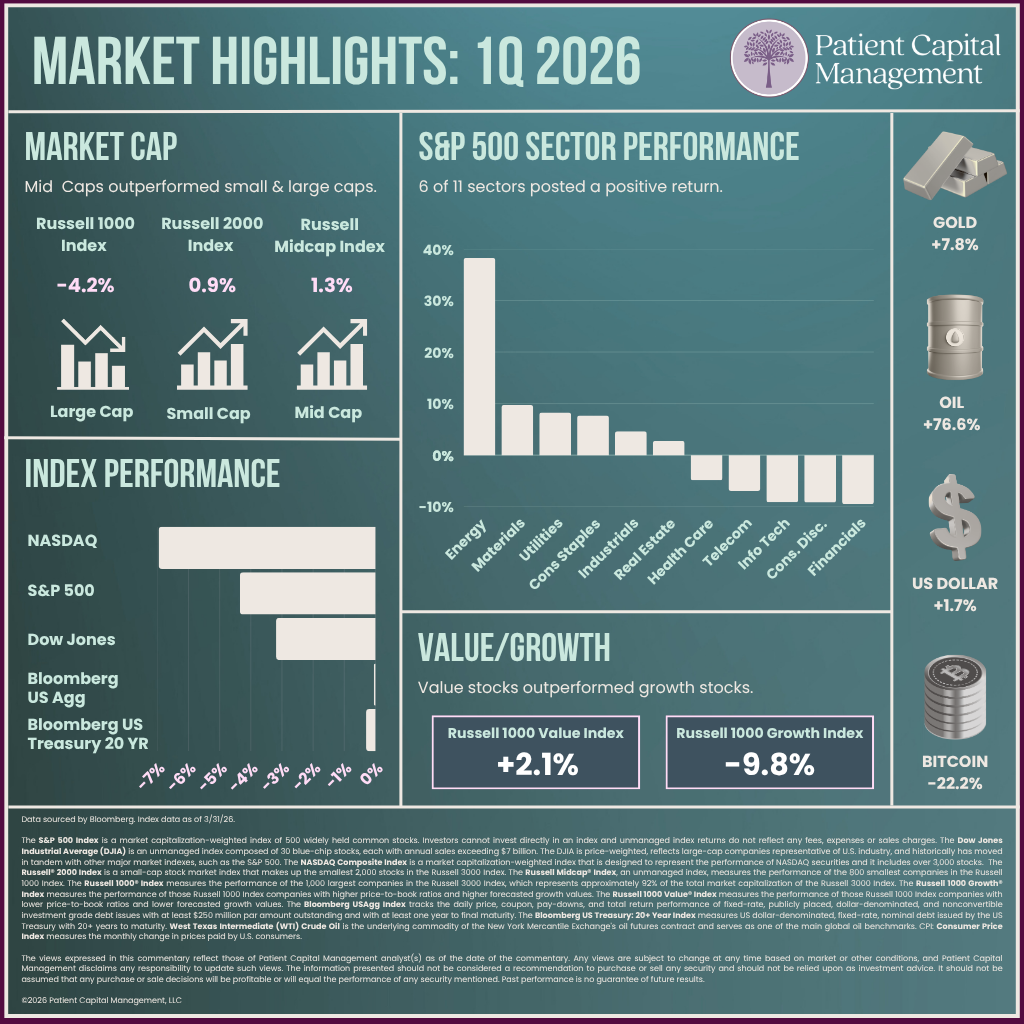
All major equity indexes declined in the quarter. The Dow Jones Industrial Average led other indexes for the second consecutive quarter, declining 3.2%, followed by the S&P 500's 4.4% loss and the Nasdaq Composite's 7.0% drop. Six of the eleven sectors in the S&P 500 posted positive returns. Energy stole the show, gaining 38.3%, followed by Utilities and Materials with returns of 9.7% and 8.3%, respectively. Financials were the worst performer, declining 9.5%, followed by Consumer Discretionary’s fall of 9.2%.
Certain areas of the market saw sharp declines. Business development companies BDCs fell 16% from their January highs, software declined 29%, and Bitcoin dropped 39%, marking the 18th time it has fallen more than 30% since 2010. The Magnificent 7 also broadly underperformed, with an equal weighted average return of -12.1% compared to the S&P 500’s 4.4% decline. Despite this, the market appeared to broaden, with the S&P 500 Equal Weighted Index outperforming the cap weighted index by 500 basis points.
Mid-caps led the quarter, with the Russell Mid-Cap Index gaining 1.3%, outperforming both large-caps and small-caps. The Russell 2000 gained 0.9% while the Russell 1000 declined 4.2%. Value outperformed growth for the second consecutive quarter with the Russell 1000 Value Index rising 2.1% versus the Russell 1000 Growth Index's decline of 9.8%.
Bonds outperformed all major equity indexes. The 10-yr outperformed both US Corporates and long-dated treasuries with the 10yr posting a gain of 3.6% while the Bloomberg Aggregate remained largely flat and long-dated Treasuries fell 0.3% in the quarter.
The US Dollar rose 1.7%, while Gold extended its remarkable run, gaining 7.8% following last year's 56% gain. West Texas Intermediate (WTI) crude went parabolic, soaring 76.6% while Brent crude rose 94.5%. Bitcoin declined for the second consecutive quarter, sliding 22.2% to close at $68,194 and down 46% from its all-time-high reach in late 2025.
Data sourced by Bloomberg. Index data as of 03/31/26.
The S&P 500 Index is a market capitalization-weighted index of 500 widely held common stocks. Investors cannot invest directly in an index and unmanaged index returns do not reflect any fees, expenses or sales charges. The Dow Jones Industrial Average (DJIA) is an unmanaged index composed of 30 blue-chip stocks, each with annual sales exceeding $7 billion. The DJIA is price-weighted, reflects large-cap companies representative of U.S. industry, and historically has moved in tandem with other major market indexes, such as the S&P 500. The NASDAQ Composite Index is a market capitalization-weighted index that is designed to represent the performance of NASDAQ securities and it includes over 3,000 stocks. The Russell® 2000 Index is a small-cap stock market index that makes up the smallest 2,000 stocks in the Russell 3000 Index. The Russell Midcap® Index, an unmanaged index, measures the performance of the 800 smallest companies in the Russell 1000 Index. The Russell 1000® Index measures the performance of the 1,000 largest companies in the Russell 3000 Index, which represents approximately 92% of the total market capitalization of the Russell 3000 Index. The Russell 1000 Growth® Index measures the performance of those Russell 1000 Index companies with higher price-to-book ratios and higher forecasted growth values. The Russell 1000 Value® Index measures the performance of those Russell 1000 Index companies with lower price-to-book ratios and lower forecasted growth values. The Bloomberg US Treasury: 20+ Year Index measures US dollar-denominated, fixed-rate, nominal debt issued by the US Treasury with 20+ years to maturity. The Bloomberg USAgg Index is a broad-based flagship benchmark that measures the investment grade, US dollar- denominated, fixed-rate taxable bond market. The index includes Treasuries, government-related and corporate securities, MBS (agency fixed-rate pass-throughs), ABS and CMBS (agency and non-agency). West Texas Intermediate (WTI) Crude Oil is the underlying commodity of the New York Mercantile Exchange's oil futures contract and serves as one of the main global oil benchmarks. CPI: Consumer Price Index measures the monthly change in prices paid by U.S. consumers. PCE: Personal consumption expenditures includes a measure of consumer spending on goods and services among households in the US. PCE, CPI, and inflation rates based on available data at the time the piece was written and are not guaranteed to stay the same in the future. The Magnificent 7 stocks are a group of large-cap companies in the technology sector, including Alphabet (GOOGL), Amazon (AMZN), Apple (AAPL), Meta (META), Microsoft (MSFT), Nvidia (NVDA), and Tesla (TSLA) that due to their size and performance accounted for roughly one-third of the S&P 500’s total market capitalization.
The views expressed in this commentary reflect those of Patient Capital Management analyst(s) as of the date of the commentary. Any views are subject to change at any time based on market or other conditions, and Patient Capital Management disclaims any responsibility to update such views. The information presented should not be considered a recommendation to purchase or sell any security and should not be relied upon as investment advice. It should not be assumed that any purchase or sale decisions will be profitable or will equal the performance of any security mentioned. Past performance is no guarantee of future results.
©2026 Patient Capital Management, LLC
Share