The investor’s behavioral barometer reads optimistic. Though we believe the path of least resistance for the market continues to be higher, this quarter I was struck by advancing enthusiasm. Market prospects are best when moods are sour, though some of the best returns occur during the latest stages of a bull market. We think that’s where we sit today.
The S&P 500 gained 15.2% in the quarter as markets recovered their first quarter losses and semiconductors surged on the back of AI-driven shortages. The Opportunity Equity Strategy 17.3% net, outperforming the index. For the first half, the strategy gained 10.4% outpacing the benchmark.
| QTD | YTD | 1-Year | 3-Year | 5-Year | 10-Year | Since Inception (12/30/1999) | |
| Opportunity Equity Strategy (gross of fees) | 17.6% | 11.0% | 35.9% | 27.0% | 6.0% | 16.2% | 9.8% |
| Opportunity Equity Strategy (net of fees) | 17.3% | 10.4% | 34.5% | 25.7% | 5.0% | 15.0% | 8.7% |
| S&P 500 Index | 15.2% | 10.4% | 22.3% | 20.6% | 13.4% | 15.5% | 8.3% |
| S&P 500 Value Index | 8.0% | 8.0% | 18.4% | 14.4% | 11.3% | 11.9% | 7.4% |
This year, it’s been difficult to outperform without exposure to beneficiaries of AI spend, particularly semiconductors -- the Philadelphia Semiconductor Index exploded a whopping 101.7% in the first half. Our only exposure, Nvidia (NVDA $202.78), didn’t help much, as it lagged the market. Technology overall accounted for 82% of the market’s first half gains whereas our modest tech exposure was a net drag.
We find ourselves in familiar territory. We’ve managed to outperform despite being underweight technology, the market’s main driver for the past decade-plus (a bad call!).
In the quarter, our healthcare exposure drove most of our performance despite the sector lagging the market overall. Six of our seven healthcare companies gained more than 20% in the first half, contributing 935 basis points to strategy performance.
| 1H26 Return |
|
| RPRX | 46.5% |
| PGEN | 36.4% |
| ILMN | 34.1% |
| CVS | 32.5% |
| UNH | 27.6% |
| BIIB | 22.8% |
| TEM | -1.9% |
These investments are emblematic of our process. A few years ago, healthcare hit a 50-year relative valuation low. The sector was ripe for contrarian, value investors. We initiated positions during weakness when the market didn’t reflect the long-term fundamentals of the businesses. It took the market some time to come around to our view, but our patience was rewarded.
We think elevated single stock volatility, and the market’s myopic focus on the next quarter or 6 months, continues to create significant opportunities for contrarian, patient investors like us.
At a macro conference I attended in June, during a hedging discussion, one moderator from a big bank mentioned the challenge of monetizing hedges effectively. She said her hedge fund clients failed to profit from hedges in March’s selloff because the market rebounded before they cashed in.
When I mentioned to my partner Bill Miller that I was troubled by this bubbly sentiment, he astutely reminded me that few consistently practice what they are preaching.
It’s not surprising to see elevated complacency after 17 years of 15% annualized returns for the S&P 500. Dip buying has been rewarded for decades. Investors now see opportunity.
This wasn’t always the case. In the early days of this secular bull market, every rally was met with fear of an imminent reversal. Risk management was the top consideration. Demand for hedges surged.
In 2010, after hedge funds lagged the market significantly, one article included the following quote: "Hedge fund managers are significantly more conservative than they were at the beginning of 2008, and I don't think there are really the mega opportunities, like there were in subprime in '07 and '08," said Virginia Parker, chief investment officer at Parker Global Strategies, a firm that advises institutional investors on hedge funds."i
Now the market is nearly 6x higher and valuations 55% greater and investors see abundant opportunities! There’s finally confidence that every selloff should be bought. The irony is that the best opportunities are born from low prices and moribund sentiment. But the perception of opportunities follows trailing returns.
Other speculative indicators grew too. SpaceX (SPCX $152.16) completed the largest IPO (initial public offering) in history, raising $86B -- more than double the previous record (Saudi Aramco). Retail demand, a driving market force, was astronomical, with retail buying hitting a single day record that day. Margin debt is at record levels and levered ETFs have exploded. M&A also set a record in the first half.
Today’s retail trading environment echoes the late 90’s. Shortly after I started in the business in the early 2000’s, I attended a Harvard Behavioral Finance seminar where we learned about irrational exuberance. The following hilarious video, a commercial from Ameritrade from 1999, was shown. Today, the vibe would resonate with many.
That’s not to say the bull market is doomed. Frothiness still falls short of what we observed at the peak of the Innovative Disruption bubble in the second quarter of 2021, and pales in comparison to the late 90’s.
By the middle of 2021, the S&P 500 had gained 41% over the prior twelve months (vs. 22% today) with the hottest stocks, exemplified by Cathy Wood’s ARK Innovation ETF up 86%. While today’s biggest winners, the semiconductors, are up far more (+159% 12-month gain for Philadelphia semiconductor index), other indicators look better.
Both periods register as euphoric on Citigroup’s panic-greed index, but 2021 was more extreme. Today, S&P 500 valuations are lower while earnings growth is higher. Elevated inflation plagues both periods, but today’s interest rate levels better reflect the situation (see details in Exhibit A below).
Exhibit A
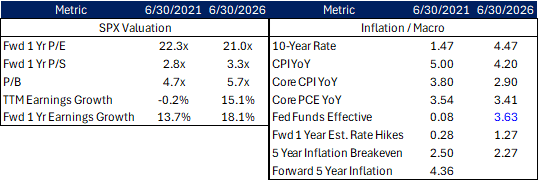
Market losses in 2022 resulted from sharp interest rate increases (SPX down 18.2% and ARKK down 67.1% in 2022). We won’t see similar increases from here with the Fed funds rate sitting above the core inflation rate.
The late 90s reached euphoric extremes. Outside of semiconductors, the Tech Bubble gains dwarfed current ones. From Netscape’s IPO in August 1995, the S&P 500 gained 195% through the peak in March 2000, with the tech sector up 564%.
Since Chat GPT’s launch in November 2022, the S&P 500 has gained 93% with tech up 187% (note: we need another year to match the duration of that 90’s run). Back then, semiconductors gained 589% vs. the current 535%.
At the stock market peak in 2000, the S&P 500 traded at 24.6x forward 12-months earnings vs. 20.0x today. Today’s tech sector valuation of 24.8x pales in comparison to the prior period’s 61.0x. Fortunately, unlike the late 90’s, stock prices have moved in lockstep with earnings and multiples haven’t expanded, creating a more stable base.
Citigroup’s bear market checklist has 11.5 of 18 indicators flashing caution vs. 17.5 at the March 2000 peak.
The chief determinant of market prospects likely remains the AI revolution, where some concerning signs have emerged. AI has accounted for a significant chunk of economic growth. Surging demand and supply constraints have boosted prices and earnings.
A period of “tokenmaxxing” (eg – maxing out your AI/token usage) has evolved into more rationality. Companies like Uber and Microsoft have gated usage to manage exploding costs. Companies are saving money by swapping to cheaper open-source Chinese models. One startup we spoke with rationalized agent prompts, cutting token usage to 1/3 of their allotted amount. They weren’t yet cutting the amount they purchased due to shortages and additional potential use cases, but that prospect remains.
Many question the risk of model commoditization and companies’ ability to generate adequate returns on capital for their massive investment.
Recent evidence suggests AI data center returns on capital (ROIC) are currently very strong. xAI’s (SpaceX) deals with Google (GOOGL $358.89) and Anthropic suggest phenomenal ROICs of 30-40%ii as detailed in an excellent Substack note by Journal of a Golfing Investor.
| Google Deal | Anthropic Deal | |
| Annual contract revenue | $11.0B | $15.0B |
| Less running costs | -$0.7B | -$1.25B |
| Cash operating profit | $10.3B | $13.75B |
| Less depreciation, using 4-year life | -$3.75B | -$5.25B |
| Operating profit | $6.55B | $8.50B |
| Capital base used | $15B | $21B |
| ROIC before tax | ~44% | ~40% |
| ROIC after tax, using 21% tax rate | ~35% | ~32% |
Overall, we think the environment continues to be favorable. We remain extraordinarily early in the AI evolution, and transformation potential is enormous. Public market valuations are reasonable. AWS raised prices in early July suggesting overall demand continues to exceed supply – the most critical factor of all!
Still, we prefer pessimism to optimism. As Warren Buffett says, it’s better to be greedy when others are fearful. We avoid areas with excessive enthusiasm and rotate into those with more favorable conditions.
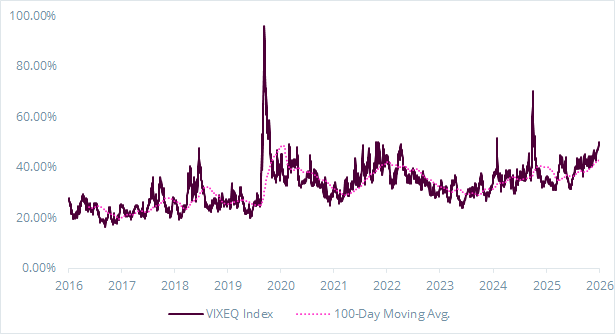
Fortunately, while overall market volatility has been low, single stock volatility remains elevated. The chart below shows the single stock VIX of the S&P 500. These swings create continuous pockets of opportunity to exploit gaps between market expectations and long-term fundamentals.
We’ve recently been adding to weakness in numerous areas, including QXO (QXO $14.58), Adobe (ADBE $222.65), bitcoin ($63,263.81), Coinbase (COIN $158.44) and Meta (META $631.48). We’ve also initiated new positions in several payments companies, Adyen (ADYEN €834.50) and Global Payments (GPN $74.38).
QXO is one of our favorite ideas at these levels. The stock traded down 50% from the highs. The cause was arb pressure from their Topbuild deal and hedge fund selling pressure due to expectations for a weak quarter from fewer storms (less roofing business) and a weak housing market.
These myopic, short-term pressures have allowed us to add to our stake at attractive prices. We think the stock should compound at ~30% per year over the next 3-5 years as the company increases profits by 2-3x by 2030.
Payments companies traded off broadly due to myriad concerns, from declining secular growth from cash digitization, to competitive concerns, and blockchain/stablecoin threats. We think business fundamentals are better than market prices suggest. Global Payments (GPN) and Adyen (Adyen) are at opposite ends of the spectrum.
GPN is an acquisitive legacy merchant acquirer that just completed a large acquisition (Worldpay) transforming it into the most scaled player. The stock recently hit a 5-year low this year. At current prices, it’s down 2/3 from the 2021 highs. Poor deals and competitive pressures have plagued the company.
We think a combination of improved competitiveness and a beaten down valuation has finally made the stock attractive. Its expanded scale and Genius point-of-sale offering are helping it compete more effectively. We think the company can sustain growth at a mid-single digit rate.
It recently reached a deal with activist investor Elliott to add new Board members, which should prevent more unattractive acquisitions. The valuation is attractive. We expect it to generate ~$10 in free cash flow per share next year resulting in a handsome 13% free cash flow yield. We expect this to grow ~40% to $14+ per share in 2028 (19% yield). We also expect most of this cash to go towards share repurchase.
Adyen (Adyen €834.50), on the other hand, sports one of the most digitally advanced payments infrastructures. Still, the stock price has been pressured by competitive concerns. At the recent lows, it was nearly 60% off its 2025 all-time high. While the core ecommerce business has reached ~50% penetration in the US and Europe, we believe omnichannel and international markets still present huge runway for growth. Adyen’s advantages should enable it to expand wallet share and sustain mid-teens topline growth for the foreseeable horizon, well above market-embedded expectations of mid-to-high single digits. We expect this compounder to yield high teens-to-low twenties rates of return.
Last quarter, we discussed bitcoin, Coinbase and Adobe so we won’t drill in on those here. We still find them all quite compelling.
While the Mag 7 have mostly trailed the market, of the ones we own, Meta is the notable laggard, down 14% over the past year. The market has grown concerned about its aggressive AI investments on the verge of taking free cash negative. We think this pessimism created an attractive area to add to our position.
Meta’s new formidable AI talent and access to compute create the conditions for success. Mark Zuckerberg is a beast. We aren’t surprised to hear rumors that Meta might sell compute given the ROICs on recent deals (see above). If Meta shows any positive signs from its recent investments, as we expect, we could see the stock behave in a similar manner to Alphabet’s after its successes.
We also still have confidence in our other top holdings: Precigen (PGEN $5.53), Royalty Pharma (RPRX $57.96), Citigroup (C $139.57), Alphabet (GOOGL $358.89), UnitedHealth Group (UNH $431.68) and Amazon (AMZN $247.04).
One of our biggest challenges is striking the right balance between letting our winners run and opportunistically deploying capital to new ideas. We try to balance both carefully.
We appreciate our clients’ support and investment. Please reach out anytime with questions or for an update.
FOR INSTITUTIONAL INVESTORS ONLY
Stock prices as of 7/9/26
Ihttps://www.reuters.com/article/world/hedge-funds-offered-weak-returns-in-2010-idUSTRE6BU1W7/
IIhttps://journalofgolfinginvestor.substack.com/p/journal-23-the-trillion-dollar-question
The views expressed in this commentary reflect those of Patient Capital Management portfolio managers as of the date of the commentary. Any views are subject to change at any time based on market or other conditions, and Patient Capital Management disclaims any responsibility to update such views. These views are not intended to be a forecast of future events, a guarantee of future results or investment advice. Because investment decisions are based on numerous factors, these views may not be relied upon as an indication of trading intent on behalf of any portfolio. Any data cited herein is from sources believed to be reliable, but is not guaranteed as to accuracy or completeness. The information presented should not be considered a recommendation to purchase or sell any security and should not be relied upon as investment advice. It should not be assumed that any purchase or sale decisions will be profitable or will equal the performance of any security mentioned. References to specific securities are for illustrative purposes only. Portfolio composition is shown as of a point in time and is subject to change without notice.
All historical financial information is unaudited and shall not be construed as a representation or warranty by us. References to indices and their respective performance data are not intended to imply that the Strategy’s objectives, strategies or investments were comparable to those of the indices in technique, composition or element of risk nor are they intended to imply that the fees or expense structures relating to the Strategy or its affiliates, were comparable to those of the indices; since the indices are unmanaged and cannot be invested in directly.
Portfolio holdings and portfolio discussion are for a representative Opportunity Equity account. Holdings discussed may or may not be included in all portfolios subject to account guidelines.
The performance information depicted herein is not indicative of future results. There can be no assurance that Opportunity Equity’s investment objectives will be achieved and a return realized. Returns for periods greater than one year are annualized.
The S&P 500 Index (SPX) is a market capitalization-weighted index of 500 widely held common stocks. The S&P 500 Value Index is a subset of the S&P 500 that measures the performance of large-cap U.S. equities exhibiting strong value characteristics. It identifies these "value" stocks by evaluating three primary metrics: the book value-to-price ratio, earnings-to-price ratio, and sales-to-price ratio Investors cannot invest directly in an index and unmanaged index returns do not reflect any fees, expenses or sales charges. The Philadelphia Semiconductor Index (SOX) is a capitalization-weighted index tracking the 30 largest U.S.-traded companies involved in the design, manufacturing, and sale of semiconductors. Mag 7 refers to the Magnificent 7 stocks are a group of large-cap companies in the technology sector, including Alphabet (GOOGL), Amazon (AMZN), Apple (AAPL), Meta (META), Microsoft (MSFT), Nvidia (NVDA), and Tesla (TSLA) that due to their size and performance accounted for roughly one-third of the S&P 500’s total market capitalization. The VIX (Cboe Volatility Index) is a real-time market index that measures the stock market's expectation of volatility over the coming 30 days. Often referred to as the market's "fear gauge" or "fear index," it uses the prices of S&P 500 options to gauge investor sentiment and market risk.
Click for the Opportunity Equity Strategy Composite Performance Disclosure.
Past performance is no guarantee of future results.
©2026 Patient Capital Management, LLC
Share